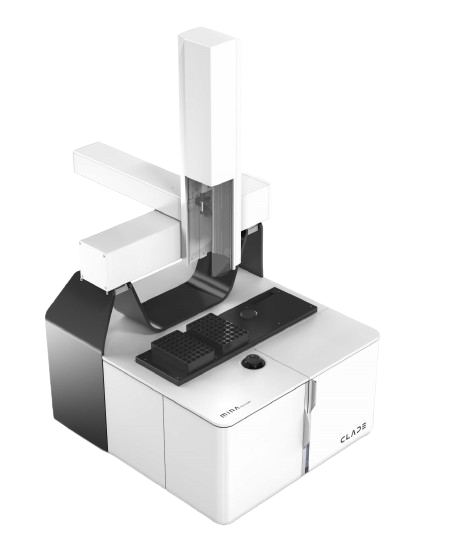
CLADE™ MIRA Analyzer
BRING UNMATCHED EFFICIENCY TO YOUR ANALYTICS
|
|
|
|
User-friendly maintenance
All user touchpoints are optimized in terms of usability. It is easy to exchange filters, pump heads or dry cartridges with only a few minutes of hands-on-time.
High-end detector
A sophisticated MCT-detector with maintenance-free thermo-mechanical cryo-cooling delivers an exceptionally good signal-to-noise ratio.
Automatic sample handling
The liquid-handling robot frees up your time for important tasks and reduces human error by fully automating the injection of your samples.


Comprehensive Instrument Test
Every day, the CLADE™ MIRA Analyzer performs an instrument test to ensure that all components work flawlessly. Spectrometer, Fluidics, Flow Cell, Detector: All of them are tested to guarantee superior quality of your data.
Repeatable measurements:
Anywhere, Anytime
A precisely orchestrated measuring procedure in combination with perfekt correction of atmospheric influences creates true digital fingerprints: Transferable and reproducible.
AquaSpecTM inside
Our patented AquaSpecTM technology is part of the MIRA Analyzer. A 7 µm flow cells enables MIR transmission spectroscopy.
Exceptionally high degree of Standardization
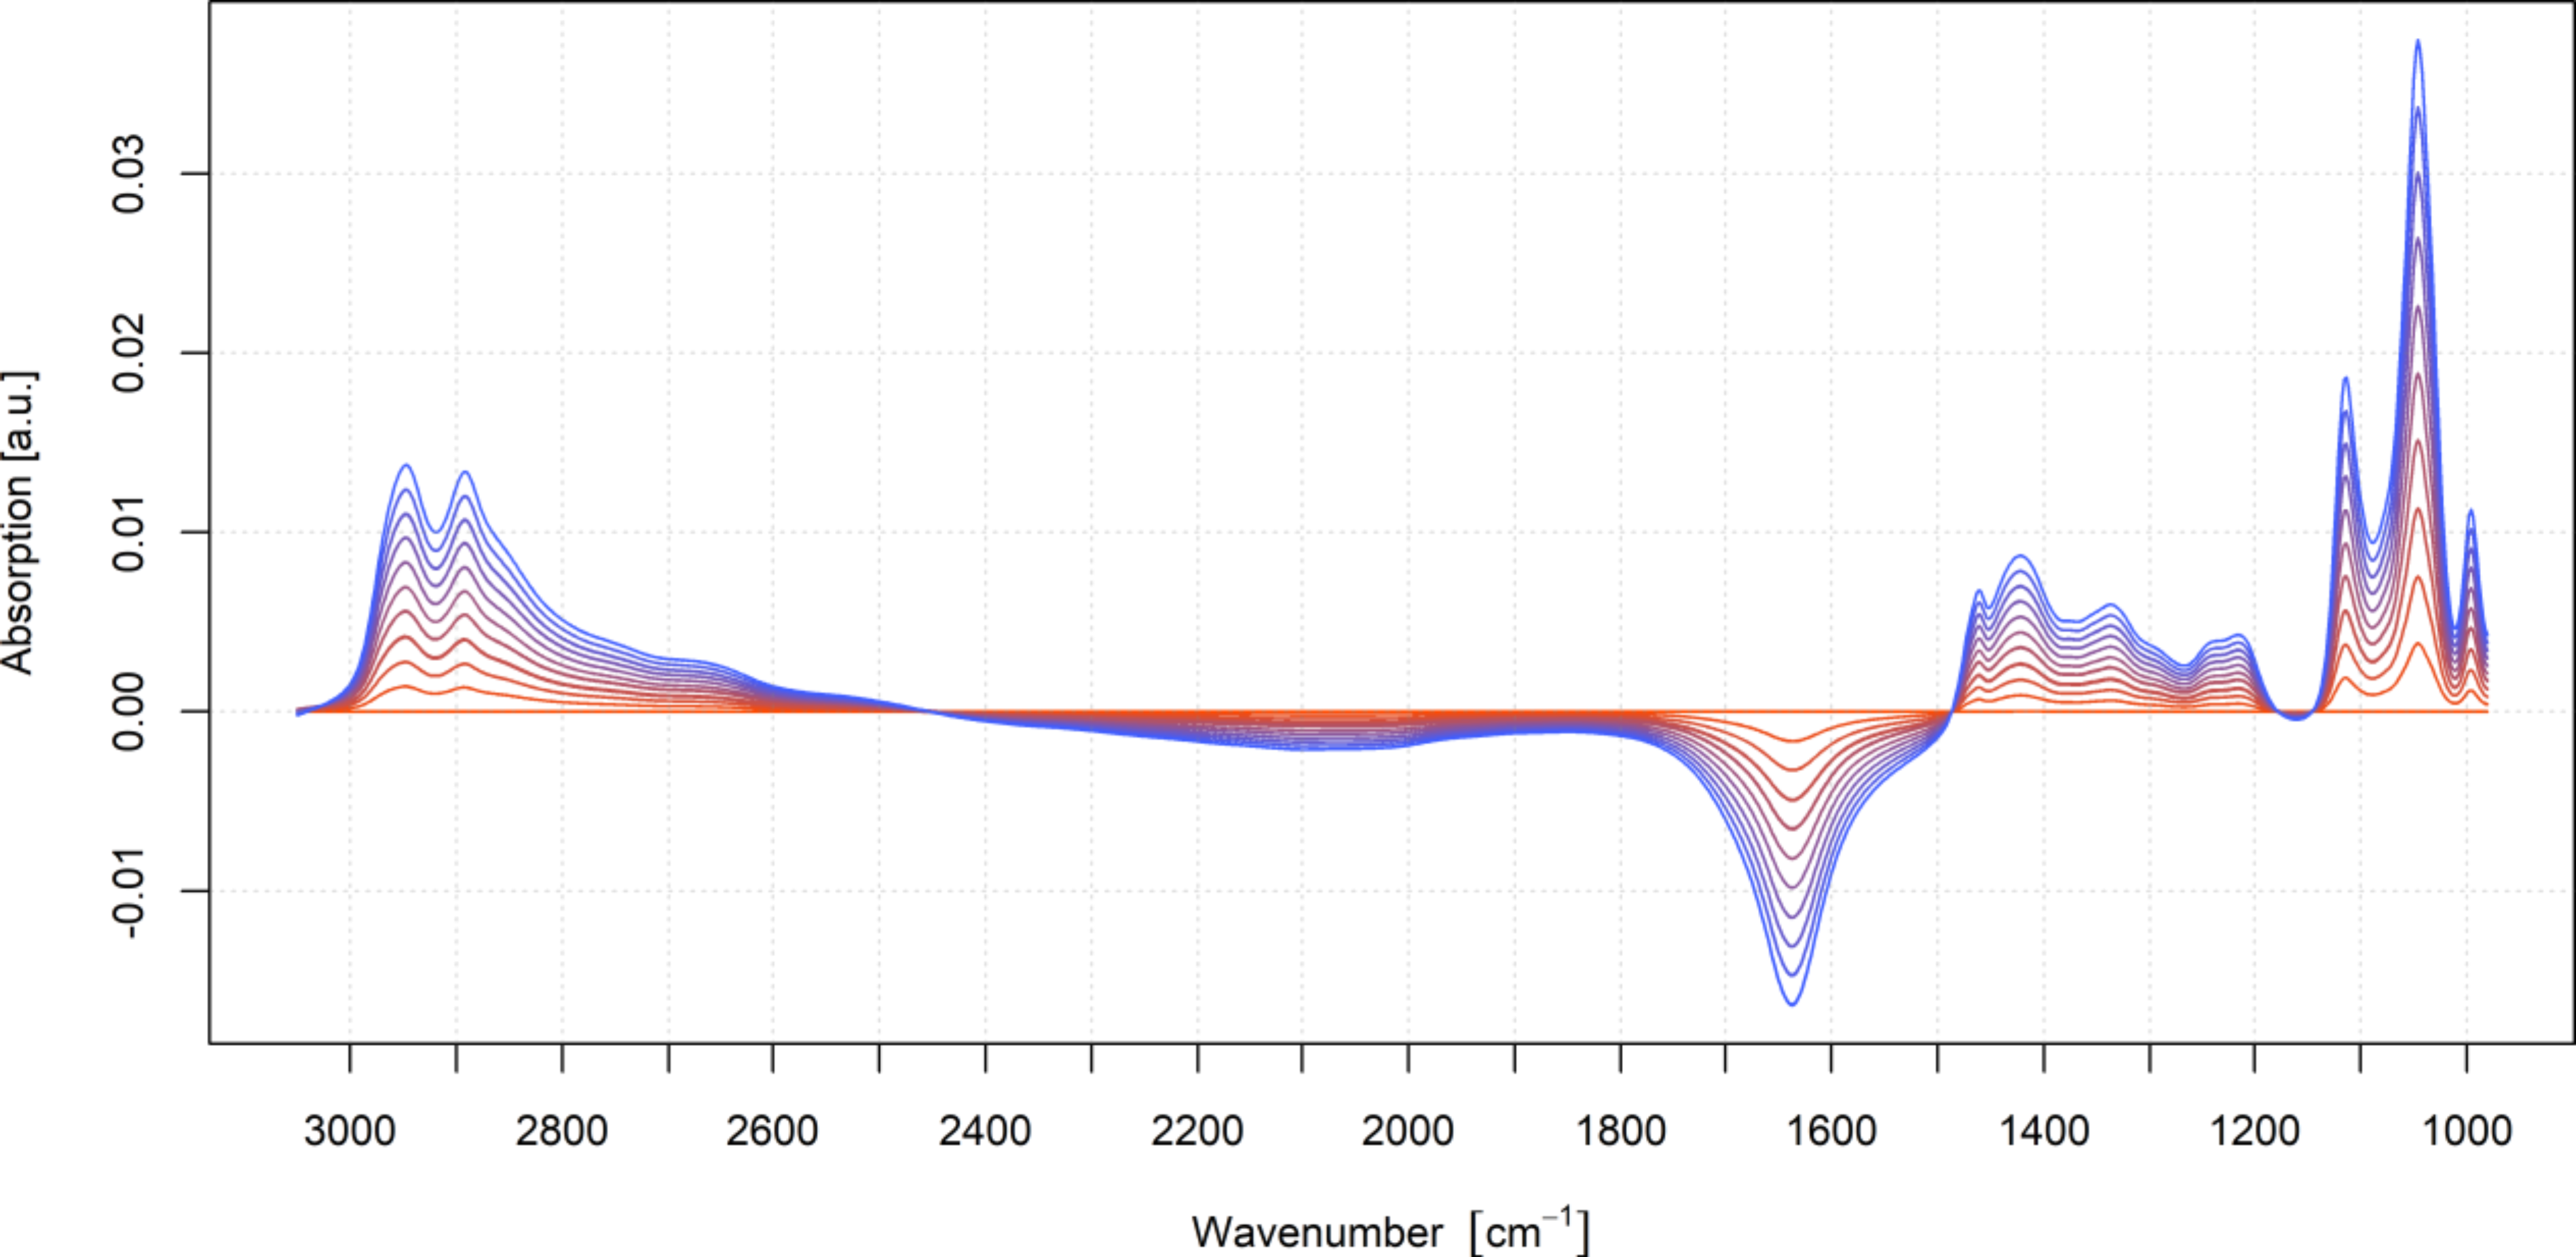
To demonstrate the analytical performance of the instrument, a series of measurements of glycerol in water in the concentration range from 0 g/L to 200 g/L was measured in equidistant 20 g/L steps with Mira.
|
Very high dynamic range |
R2 > 0.999 |
|
Exceptional high spectral repeatability (single device) |
RSD < 0.5 % |
|
Outstanding signal-to-noise ratio |
peak-to-peak signal-to-noise better than 10000:1 |
|
High resolution |
4 cm-1 |
|
Speed |
4 min measurement time |
|
Measurement range |
3050 to 980 cm-1 |

Figure 1: Standard absorption spectra. A series of measurements of glycerol in water in the concentration range from 0 g/L to 200 g/L was measured in equidistant 20 g/L steps with MIRA.
High models accuracy and robustness
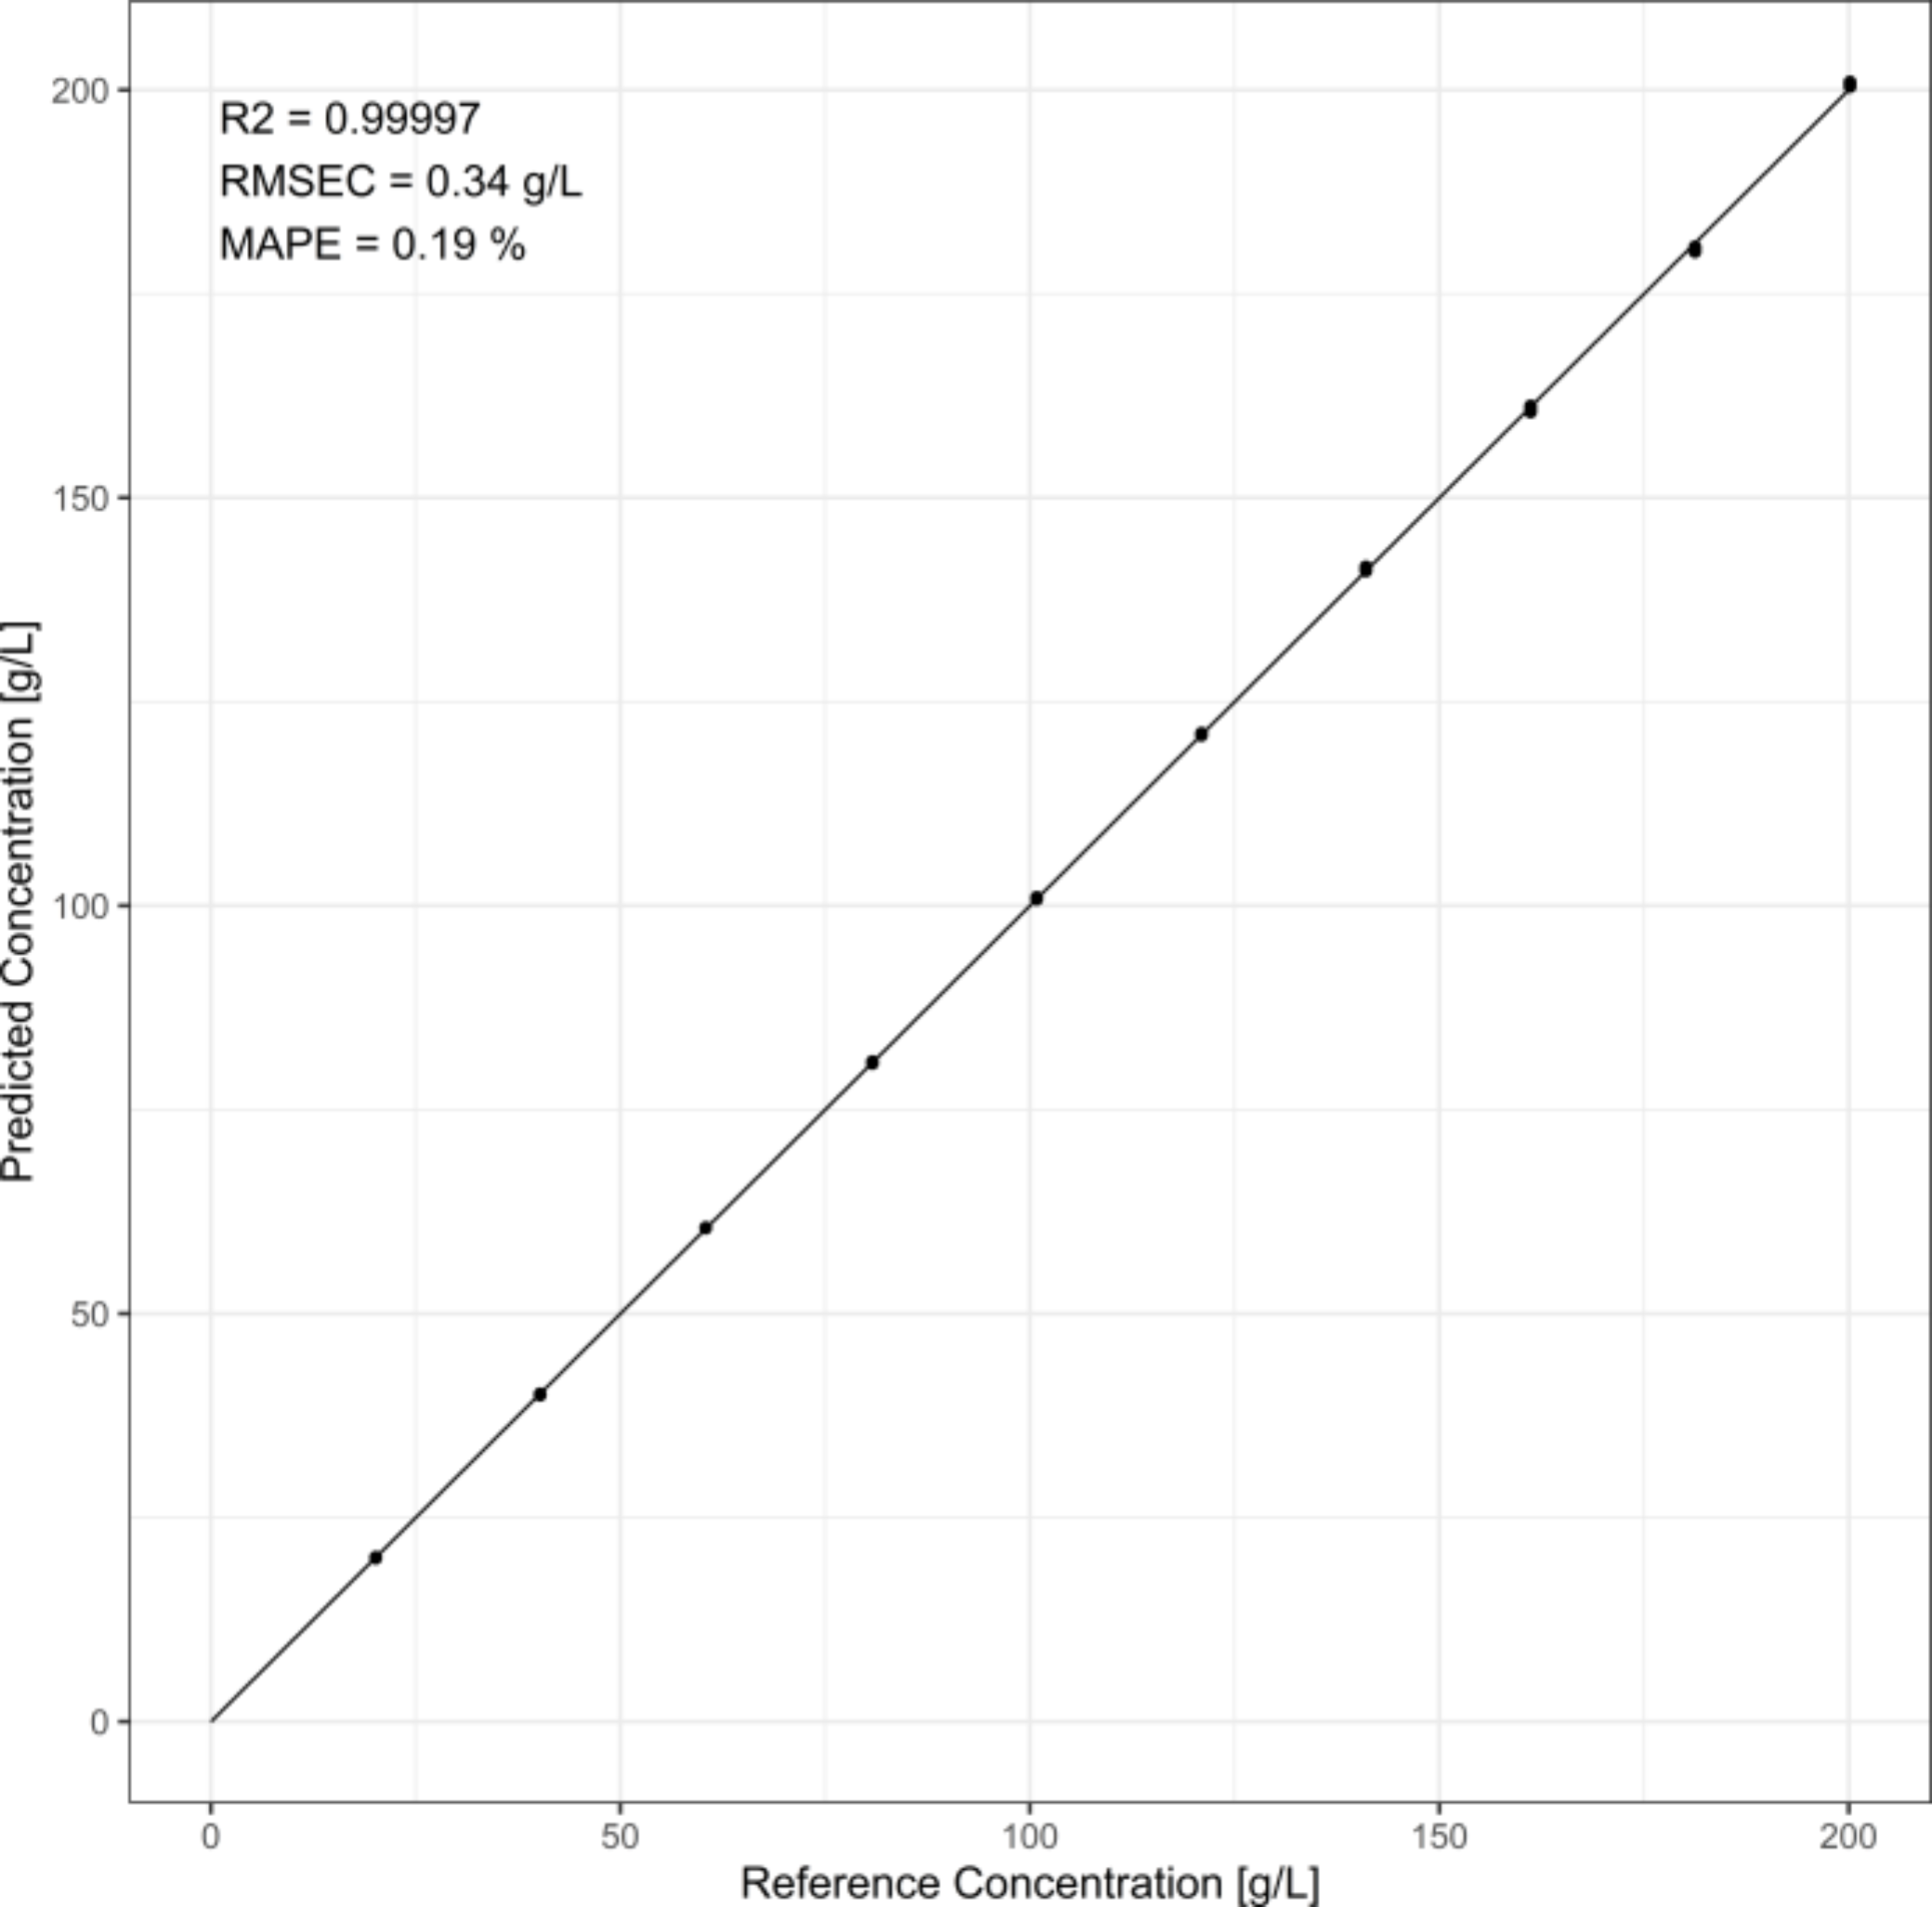
The spectra were pre-processed with a Savitzky-Golay filter before being used for the PLS model calibration. A PLS model was generated with two factors. The optimal number of factors was determined via permutation. We have achieved a prediction accuracy of 0.34 g/L or 0.19 %.
|
Exceptional high precision |
CV < 0.2 % |
|
High accuracy |
RMSEC < 0.5 g/L or MAPE < 0.5 % |

Figure 2: Predicted vs. measured plot of glycerol in water in the concentration range from 20 g/L to 200 g/L using a PLS calibration model to determine the prediction accuracy.
Further information:
